

When valuing a small business for sale, buyers focus on earnings, not revenue. In the U.S. market, two earnings metrics are used most often to represent cash flow: Seller’s Discretionary Earnings (SDE) and EBITDA. While both measure profitability, they are built for different buyers and tell different stories about the same business.
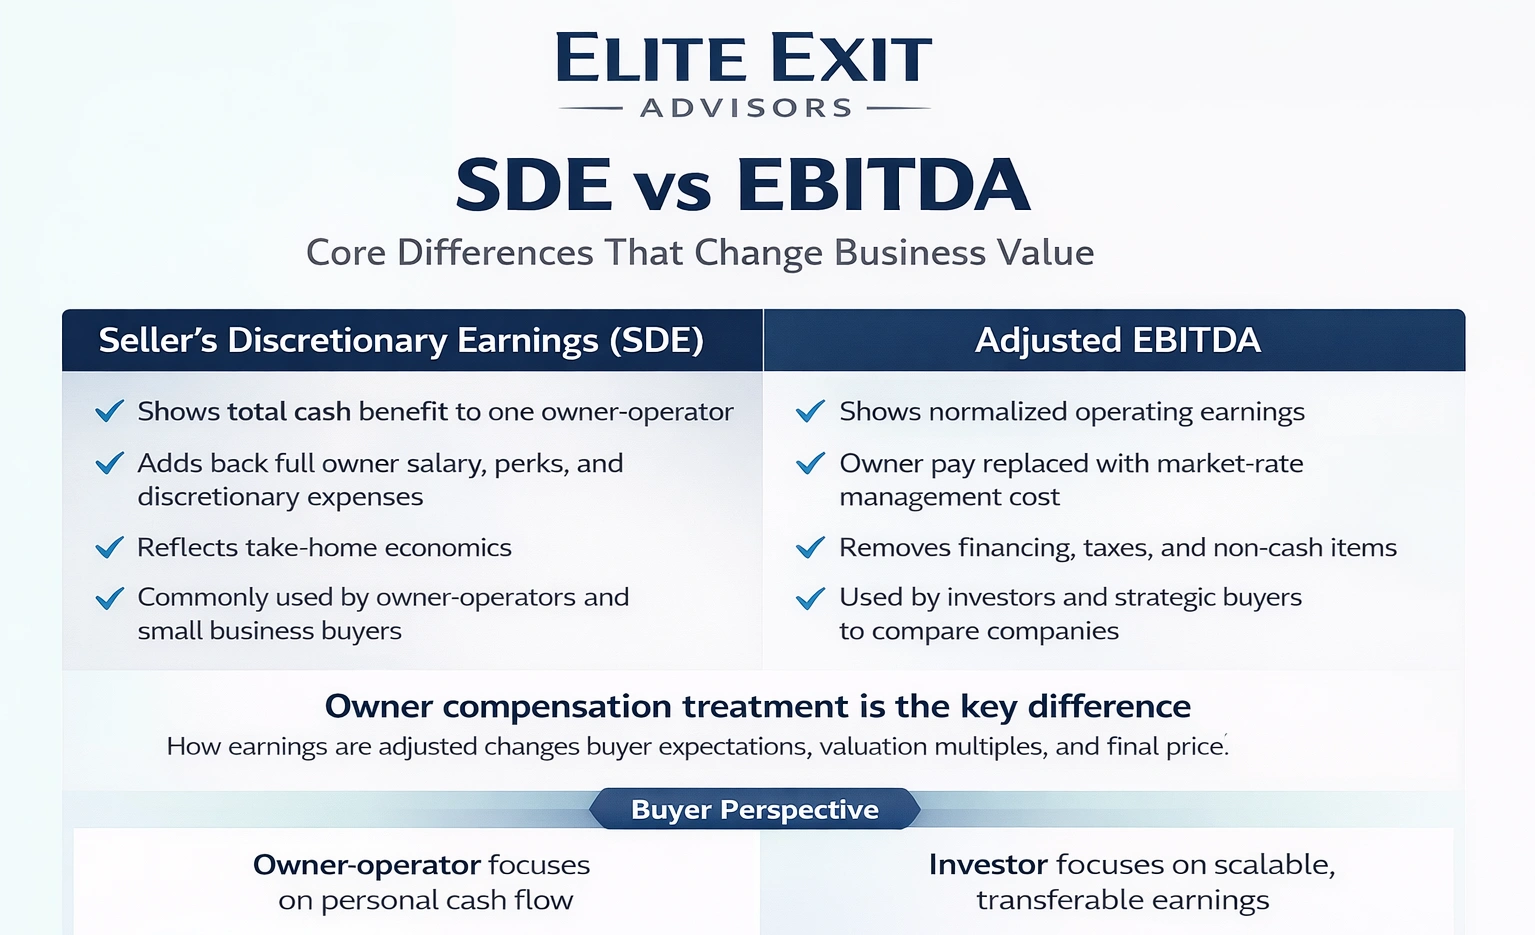
Seller’s Discretionary Earnings shows the total economic benefit available to one owner-operator. It starts with net income and adds back full owner compensation, owner-related taxes, discretionary personal expenses, and qualifying non-recurring and non-cash items. SDE answers a simple question: how much cash can a working owner take out of the business each year?
EBITDA, short for earnings before interest, taxes, depreciation, and amortization, measures operating performance independent of ownership and financing choices. In practice, buyers use adjusted EBITDA, which removes one-time and non-operating items and replaces owner pay with a market-rate management cost. This makes EBITDA useful for comparing companies and evaluating transferable earnings.
The earnings figure you present directly influences buyer interest, valuation expectations, and the final sale price.
Buyers focus on earnings because cash generation, not revenue, drives a company’s sale price.
In the U.S. market, a buyer values a business by estimating how much sustainable cash it will produce. Top-line sales can be misleading; consistent cash flow tells a clearer story about long-term viability and return.
Standardized metrics create an apples-to-apples comparison across companies. Lenders and sophisticated buyers rely on clean, supportable earnings to judge ability to service debt, return on investment, and risk.
Who the buyer is matters: an owner-operator cares about personal take-home economics, while an investor looks at transferable operating performance. Clear documentation of add-backs and a credible normalization story reduces due diligence friction and helps protect value during negotiations.
Elite Exit Advisors helps owners present the right metric and back it with reliable support to increase buyer confidence in a competitive market.
EBITDA is a common lens buyers use to compare operating performance across similar companies. It strips out financing choices and non-cash accounting to show routine operating earnings. For mid-sized to larger firms, this makes apples-to-apples comparison easier when analyzing value.
The core formula is clear: Net Income + Interest Expense + Taxes + Depreciation + Amortization. Net income is profit after all items. Interest shows financing cost. Taxes are government levies. Depreciation and amortization are non-cash charges for asset wear and intangible write-downs.
Buyers normally underwrite an adjusted version. They remove non-recurring income or expenses, non-operating items, and unusual events to estimate sustainable run-rate earnings. This helps remove distortions from one-time legal costs, sale gains, or owner-driven discretionary expenses.
Owner salary is normalized, not fully added back. Valuation replaces owner pay with a market-rate manager cost and only adds back the excess. For example, if an owner pays $200,000 but a replacement CEO would cost $100,000, the $100,000 excess is an add-back that increases adjusted EBITDA.
This metric typically drives deals for businesses showing roughly $1.5M or more in earnings. Institutional and strategic buyers often apply multiples to adjusted EBITDA because it removes financing, taxes, and accounting choices that can skew comparability across companies.
Seller’s discretionary earnings measure the total cash benefit an owner draws from a running business. This approach is especially common in smaller transactions; industry data shows that around 75% of businesses valued under $500,000 rely on SDE as the primary earnings metric, with usage still dominant in deals up to $1 million.
This metric captures the full economic benefit available to one full-time owner-operator. It blends business profit and owner pay into a single figure useful for small business valuation.
Discretionary items include owner perks and personal expenses that a new buyer may drop. Non-recurring costs are unique events that distort ongoing earnings.
When used: This figure is most common for businesses under about $1M in earnings where buyer involvement is material. Credible documentation is important; unsupported add-backs often get trimmed during diligence and can lower the final value.
Not all profit figures tell the same story about a company's cash flow. The primary practical gap is how owner pay is treated, and that treatment changes buyer expectations and price.
One measure adds back full owner salary and perks, showing total owner benefit. The other assumes a replacement manager must be paid and only adds back the excess above a market salary.
Adjusted operating earnings improve comparability. They strip financing, taxes, and non-cash items so buyers can compare performance across different companies and sizes.
Practical cue: consider owner involvement, earnings size, and transferability. Buyers will test add-backs, normalize salary, and push back on non-repeatable items during diligence.
Step-by-step reconstruction shows buyers the sustainable cash a business produces.
Net income: $700,000. Add interest $100,000 and depreciation $200,000.
Result: ebitda = $1,000,000. Then add back $150,000 excess owner compensation to get adjusted ebitda of $1,150,000.
Start with net income, add interest, taxes, depreciation, and amortization.
Then add full owner compensation and qualifying discretionary expenses. Using the same ABC Manufacturing numbers, adding the full $250,000 owner pay produces sde of $1,250,000.
Multiples translate a company’s earnings into a headline price that buyers and sellers use to compare offers. The chosen multiple depends on risk, growth, customer concentration, recurring revenue quality, and how dependent the business is on the owner.
For many owner-operated businesses, seller discretionary earnings multiples commonly fall in the 2–3x range. Near the $1.0M SDE threshold, competitive deals can push toward ~4x when fundamentals and demand are strong.
Normalized ebitda multiples generally run higher. Typical ranges:
Higher seller discretionary earnings do not guarantee greater value because the multiple applied is often lower. An owner-focused metric assumes buyer involvement, so market multiple compresses compared to investor-focused measures.
Example equivalence: $1.0M sde × 3.0 = $3.0M, while $750k ebitda × 4.0 = $3.0M. Normalizing owner pay can align the underlying economics across metrics.
Many ebitda-based deals include a working capital target. Inventory, accounts receivable, and assumed payables affect the cash delivered at close.
Total economics matter: headline price, working capital adjustments, earnouts, and seller notes all change net proceeds even when the multiple looks attractive.
Choosing the right headline metric can change how buyers perceive your company and the offers you receive.
At Elite Exit Advisors, we help owners determine whether an owner-focused number or a normalized metric best reflects transferable earnings.
Our team reviews your financials, identifies defensible add-backs, and separates discretionary from recurring expenses. That creates a clear normalization bridge buyers can verify during diligence.
Positioning matters: institutional buyers typically prefer normalized figures, while owner-operators often underwrite to the owner-focused view.
We craft a narrative that matches your buyer pool, clarifies owner involvement, and frames sustainable cash flow and performance for the market.

Our recommended next steps help turn accounting into value:
Ready to discuss your company? Book a call with Elite Exit Advisors to decide which metric fits your business and how to maximize value ahead of a sale.
A clear closing step is to pick the earnings lens that matches who will buy your business. The main difference: sde (seller discretionary earnings) shows the full owner benefit, while ebitda normalizes owner salary and focuses on operating cash flow.
If a buyer will run the business personally, discretionary earnings often reflect real take-home economics. If a manager-led investor is likely, ebitda is the comparable metric. Owner compensation, personal expenses, and salary treatment drive that gap.
Remember: a larger headline earnings number does not guarantee higher value. Multiples, risk, and working capital affect total price more than the raw earnings figure.
Compute both metrics, document add-backs, and align the chosen metric to the likely buyer. Present clean financials and reduce owner dependence to improve the multiple and final proceeds.
