

SDE multiples by industry show how much buyers typically pay for a business based on its Seller’s Discretionary Earnings, using benchmarks from real transactions within each sector to estimate fair market value. In practice, this means the same $300k SDE business can sell for very different prices depending on its industry, risk profile, and growth outlook.
For example, businesses sold between 2021–2025 found that average SDE multiples range from about 2.0x to 3.3x across industries, with an overall market average of 2.57x, based on thousands of completed deals.
Market comparables help convert normalized earnings into a realistic sale range. This approach gives sellers a defensible asking figure and lets buyers underwrite cash flow that supports acquisition finance.
Buyers need clear estimates of future cash flow to model debt service and returns. Lenders focus on coverage ratios and predictability when approving loans.
Sellers want the highest defensible value based on recent transactions and clean financials. Investors balance price against risk and expected growth.
Market-based valuation compares your firm to similar sales and applies observed ratios to normalized earnings. Use a range anchored in actual transactions rather than a single point.
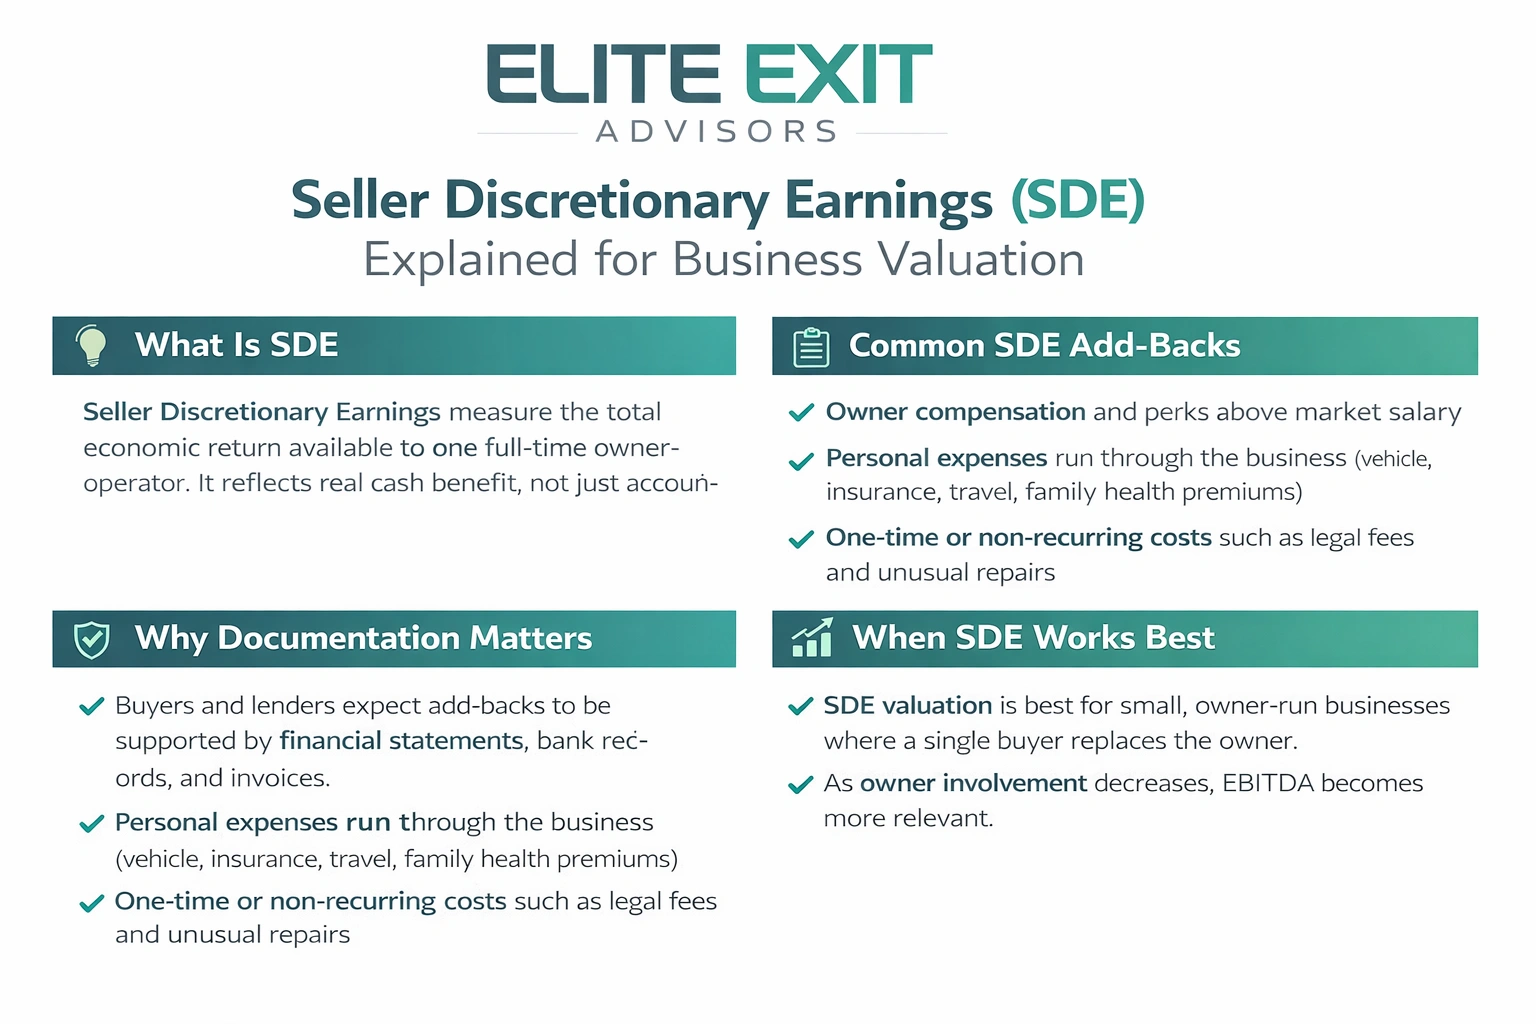
Seller discretionary earnings measure the total economic return available to one full-time owner-operator. This is not just accounting profit; it reflects the cash benefit an owner can extract in a typical year.
What is included and common add-backs
Clean documentation matters. Buyers and lenders expect add-backs to show up in financial statements, bank records, and invoices. Unsupported adjustments reduce credibility and lower a firm's valuation.
When this metric works best
This approach fits smaller, owner-run businesses where a single purchaser will take the owner role. It helps a buyer model what they can pay themselves while covering debt service and reinvestment.
Briefly, SDE business valuation is ideal for solo-run firms. As operations become professional and owner involvement drops, EBITDA and other methods gain relevance for business valuation and fairer comparisons of business worth.
Current deal data show clear ranges that help translate owner earnings into a market price. These benchmarks give sellers and buyers realistic expectations and a defensible negotiation band.
Typical range for small, owner-run businesses: Most small firms trade in a band rather than at a single point. Deal size, owner dependence, and perceived risk push results toward the low or high end of the band.
For many Main Street firms, expect a typical range roughly between 2.0x and 3.6x annual owner earnings. Move toward the lower end when revenue is small, owner-central, or customer concentration is high. Move higher with steady recurring sales, clean reporting, and visible growth.
Owner-operated manufacturers under ~$2–$3M in revenue commonly fall near 2.68x–3.54x annual owner earnings. In practice, about half of these deals cluster between 2.0x and 3.6x, so modest improvements in margin, documentation, or customer diversity can materially change value.
Ranges reflect risk, customer quality, margins, and growth potential. Two firms in the same sector can land at opposite ends of a band if one has recurring revenue and clean data while the other relies on the owner’s personal relationships.
EBITDA serves as a common yardstick for assessing operating performance across firms with different capital structures. Use it when a business has a management layer and the owner is less central to daily operations.
Define EBITDA as operating profit before interest, tax, depreciation, and amortization. It strips financing and non-cash items so investors can focus on core profitability and cash flow.
Typical ranges for smaller to mid-sized businesses sit around 3.00x–5.00x. A broader market spread shows a median near 5.4x, a 25th percentile at ~3.2x, and a 75th percentile approaching ~10.4x.
Why EBITDA helps compare firms: it evens out different debt loads, tax situations, and depreciation policies for fairer apples-to-apples checks. In negotiations, EBITDA often bridges seller expectations and lender underwriting around cash available for debt service, making it a practical valuation tool.
A revenue ratio offers a simple yardstick when profits are uneven or growth outpaces current earnings. Use revenue multiples as a secondary reasonableness check rather than the primary method for most profitable firms.
Define a revenue multiple as the ratio of enterprise value to annual revenue. A practical anchor for many manufacturing-type profiles sits near 0.73x annual revenue.
Typical small-business ranges often fall around 0.54x–0.79x, but some sectors span roughly 0.50x–2.00x depending on scale and growth.
Revenue checks help in three common situations:
Revenue does not equal profit. Two companies with identical revenue can have very different cash flow and valuation because margins differ.
Capital intensity, labor needs, and gross margins can distort top-line comparisons. Relying on revenue alone may mislead valuation decisions.
Recommended process: apply revenue multiples as a sanity check, compare implied margins to sector norms, and then return to earnings-based metrics for final valuation logic.
Perceived risk and the predictability of future cash flow drive how the market prices a small business. Owners can influence valuation through measurable operational work and clearer revenue signals. Focus on what buyers and lenders look for: durable cash flow, repeatable processes, and solid data.
Buyers reward operational efficiency that reduces dependence on a single person. Automation, standard operating procedures, and tighter labor use protect margins and support higher value.
Concrete benchmarks matter. Target inventory turnover near 5:1–10:1 and document maintenance spending in the 15%–40% range of total expenses.
Single customers accounting for more than 10% of revenue raise caution. Above 20% is high risk. If the top five clients make up over 25% of sales, expect more conservative deal terms.
Longer contracts and repeat purchase behavior improve revenue stability and reduce perceived risk. Stable revenue and predictable cash flow allow buyers to pay a premium and compress financing assumptions.
Alignment with current trends, tech-enabled manufacturing and reshoring, can strengthen growth narratives. Firms that show clear trend fit face stronger demand in the market and often capture better pricing.
Bottom line: Valuation expands or compresses based on durable cash flow and visible operational signals. Measure what buyers value, document improvements, and track these factors to improve sale outcomes.
.webp)
Choosing the right valuation approach starts with matching the metric to how the business actually runs day-to-day. This keeps decisions practical and defensible during negotiations.
Use SDE when an owner is essential and revenue sits under ~$2–$3M. Individual buyers care most about personal cash flow and will focus here.
Use EBITDA as the firm grows and management runs the operation. Sophisticated buyers and lenders prefer this for comparability.
These steps guide decisions and improve confidence in the proposed value and in your view of business worth.
Start with real deal evidence to build a valuation that buyers and lenders will accept. Use two market-based approaches to ground your ask: one shows current public pricing context and the other shows actual sale outcomes.
Comparable company analysis uses public or peer firm data to show where similar firms trade today. Precedent transactions rely on closed transactions to show what buyers paid. Combine both to see market tone and concrete deal results.
Normalize reported earnings for owner pay, personal expenses, and one-time costs. Only include adjustments you can support with bank records, invoices, or tax returns.
Start with benchmark valuation multiples, then adjust up or down for growth, concentration risk, and reporting quality. Present a clear valuation bridge: reported earnings → normalized earnings → chosen multiple range → implied valuation range. This keeps negotiations factual and reduces re-trades.
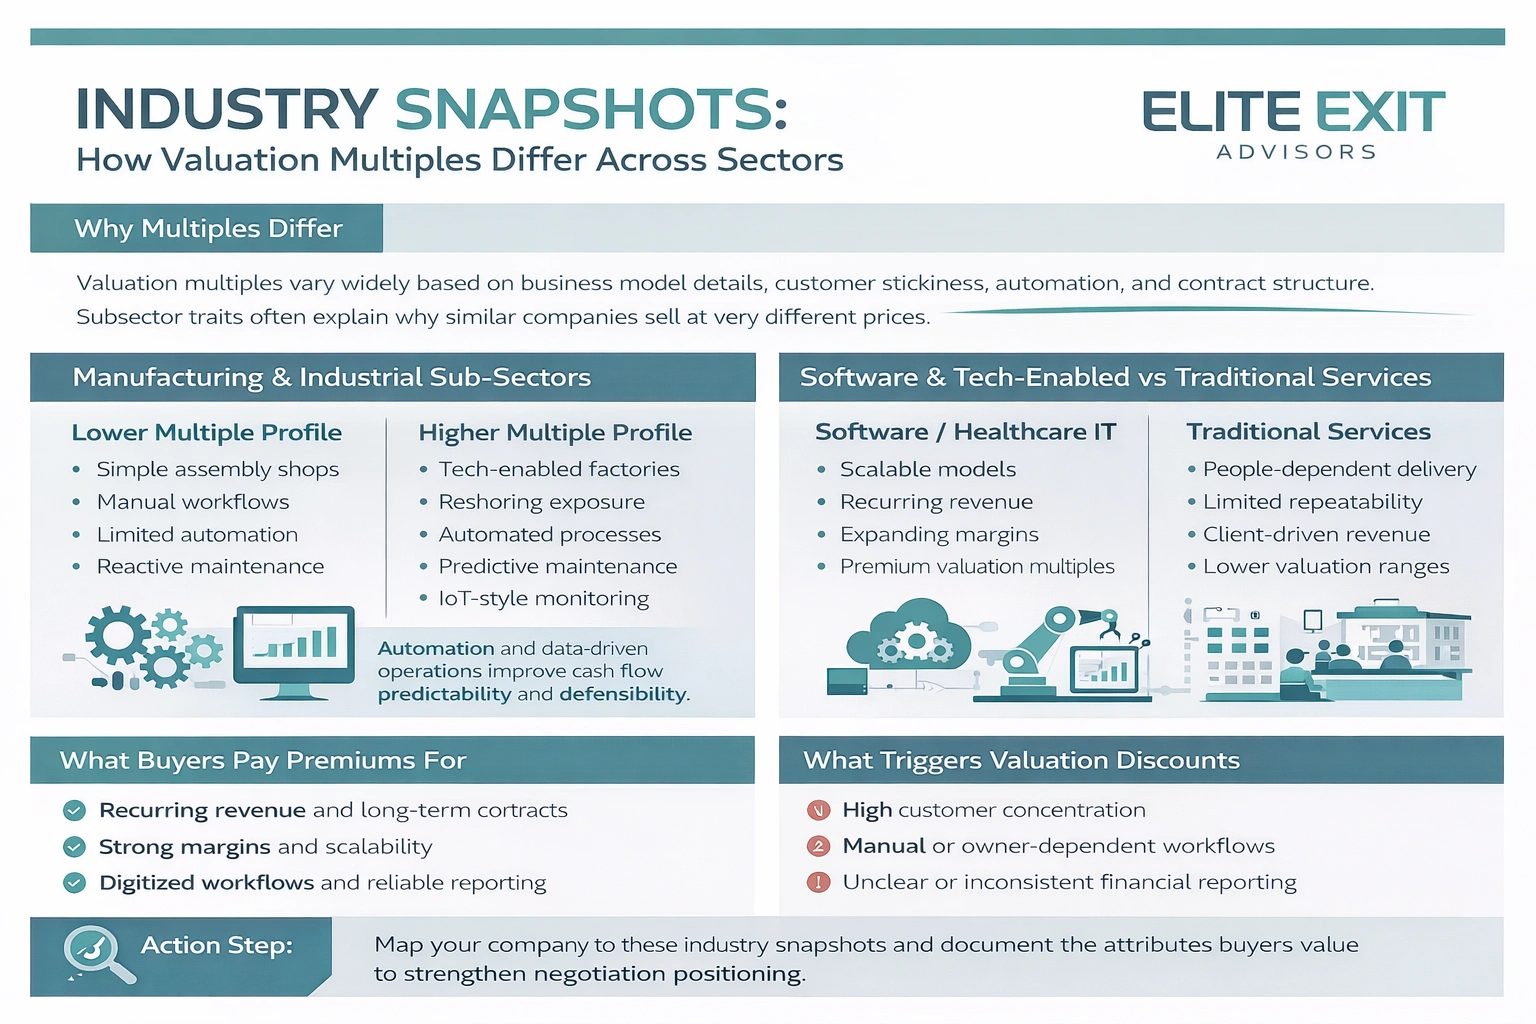
Business model details, customer stickiness, automation, and contract structure, drive large swings in observed valuation. Subsector traits often explain why two firms in the same field fetch very different sale prices.
Within manufacturing, simple assembly shops and tech-enabled factories sit at opposite ends of the range. Reshoring and automation lift perceived defensibility and push higher valuation conversations.
Buyers reward digitized workflows, predictive maintenance, and IoT-like monitoring because these reduce downtime and make cash flow more predictable.
Software and healthcare IT often command premium EBITDA and revenue numbers due to scalability, recurring models, and margin expansion potential.
Traditional service firms usually trade at lower bands when value depends on people and client relationships rather than repeatable processes.
Action: map your company's model to these snapshots and document the attributes buyers value to improve negotiation positioning in the current market.
Many sellers learn too late that one-size-fits-all averages rarely capture what makes a business worth more or less. Small lapses in finance practices or expectations about market price can cut achievable valuation and slow a sale.
Using a single sector average masks unique factors such as customer mix, margin profile, and growth runway. That can push a proposed price too high or too low and create a gap during buyer diligence.
Common failures include unsupported discretionary earnings add-backs, mixed personal and business expenses, and inconsistent bookkeeping. Buyers treat weak data as risk and reduce valuation or demand seller financing.
Anchoring to one temporary market mood can stall negotiations. When conditions shift, buyers may reopen price talks or walk, forcing painful concessions.
To protect value, maintain clean monthly closes, stash supporting documentation for discretionary earnings adjustments, and present a reasoned valuation range that reflects key factors. This makes negotiations faster and preserves credibility in the market.
Preparing to exit requires practical steps that improve perceived value and reduce negotiation friction. Elite Exit Advisors focuses on measurable fixes that buyers and lenders care about.
We select the right valuation method for your company, whether that emphasizes owner earnings, operating profit, or top-line checks. That creates a defendable range tied to real comparables and buyer expectations.
We normalize reported earnings and build an add-back file that stands up in diligence. Our approach reduces questions around cash flow and prevents value haircutting.
Priority work includes lowering customer concentration, strengthening recurring revenue or contract terms, tightening reporting, and boosting operational efficiency. These levers translate into higher, more credible valuation outcomes.
We prepare marketing materials, manage buyer Q&A, coordinate diligence, and keep negotiations anchored to documented facts. That keeps the process moving and preserves value.
How Elite Exit Advisors helps (before you go to market):
Professional support improves credibility, reduces undervaluation risk, and helps owners present defensible valuation ranges tied to documented financials and operational levers buyers value.
Next step: Book a call with Elite Exit Advisors to review your numbers, target buyer profile, and the fastest path to a higher-value exit.
Good valuation practice matches the metric to how a company runs and how buyers underwrite cash flow. Use valuation multiples as tools, not guarantees, and present a defensible range supported by real comparables.
For owner-operated firms, SDE multiples often work best because they reflect owner benefit. As firms scale and reporting matures, EBITDA multiples help buyers compare performance across similar businesses.
Revenue multiples are useful as a secondary check when margins lag or growth is the main story. Operational efficiency, customer concentration, recurring revenue, and clean data move a business toward premium outcomes.
Normalize earnings, rely on comparable data, and keep ranges narrow enough to be credible. A well-prepared exit process improves negotiating power and often makes the difference between an average result and a premium sale.
Next step: Review your numbers and documentation, then book a call to turn these insights into a defensible valuation and a stronger exit plan.
