

In the United States, sales outcomes span from several hundred thousand dollars to many billions, depending on size, growth, and market position.
Value reflects what qualified buyers will underwrite today, not only owner expectations. Asset sale and stock sale differ at a high level, and those distinctions shape the final price and the terms buyers will accept.
Buyers focus on earnings quality, cash flow stability, customer concentration, and management depth. Multiples shift with industry trends, financing costs, and transferability of operations. Typically, the process of selling a company takes 10–12 months, as buyers conduct due diligence, secure financing, and negotiate terms, which can directly impact the final valuation.
Valuation shifts with deal structure, buyer type, and what the price includes. Working capital norms, inventory treatment, and whether real estate stays inside the transaction alter outcomes. Market realities set practical limits. Comparable sales and lender underwriting determine what buyers will finance based on earnings quality and risk. In fact, most small businesses in the U.S. sell for roughly 2 to 3 times seller’s discretionary earnings (SDE), with median sale prices around $329,000–$352,000 in recent data, which illustrates how real market multiples concretely anchor theoretical value ranges into actual offers, often compressing expectations into market‑tested results
Different buyers value size, growth, and owner dependence differently. An owner-operated firm may trade on SDE, mid-market firms on EBITDA, and high-growth firms on revenue or DCF projections.
Small firms usually fetch lower multiples and greater variance. Larger, stable firms attract higher multiples and institutional bids. Timing and interest rates also widen or compress ranges.
Sale outcomes often cluster around common multiples rather than a single headline number. That makes ranges useful for planning, negotiation, and lender review.
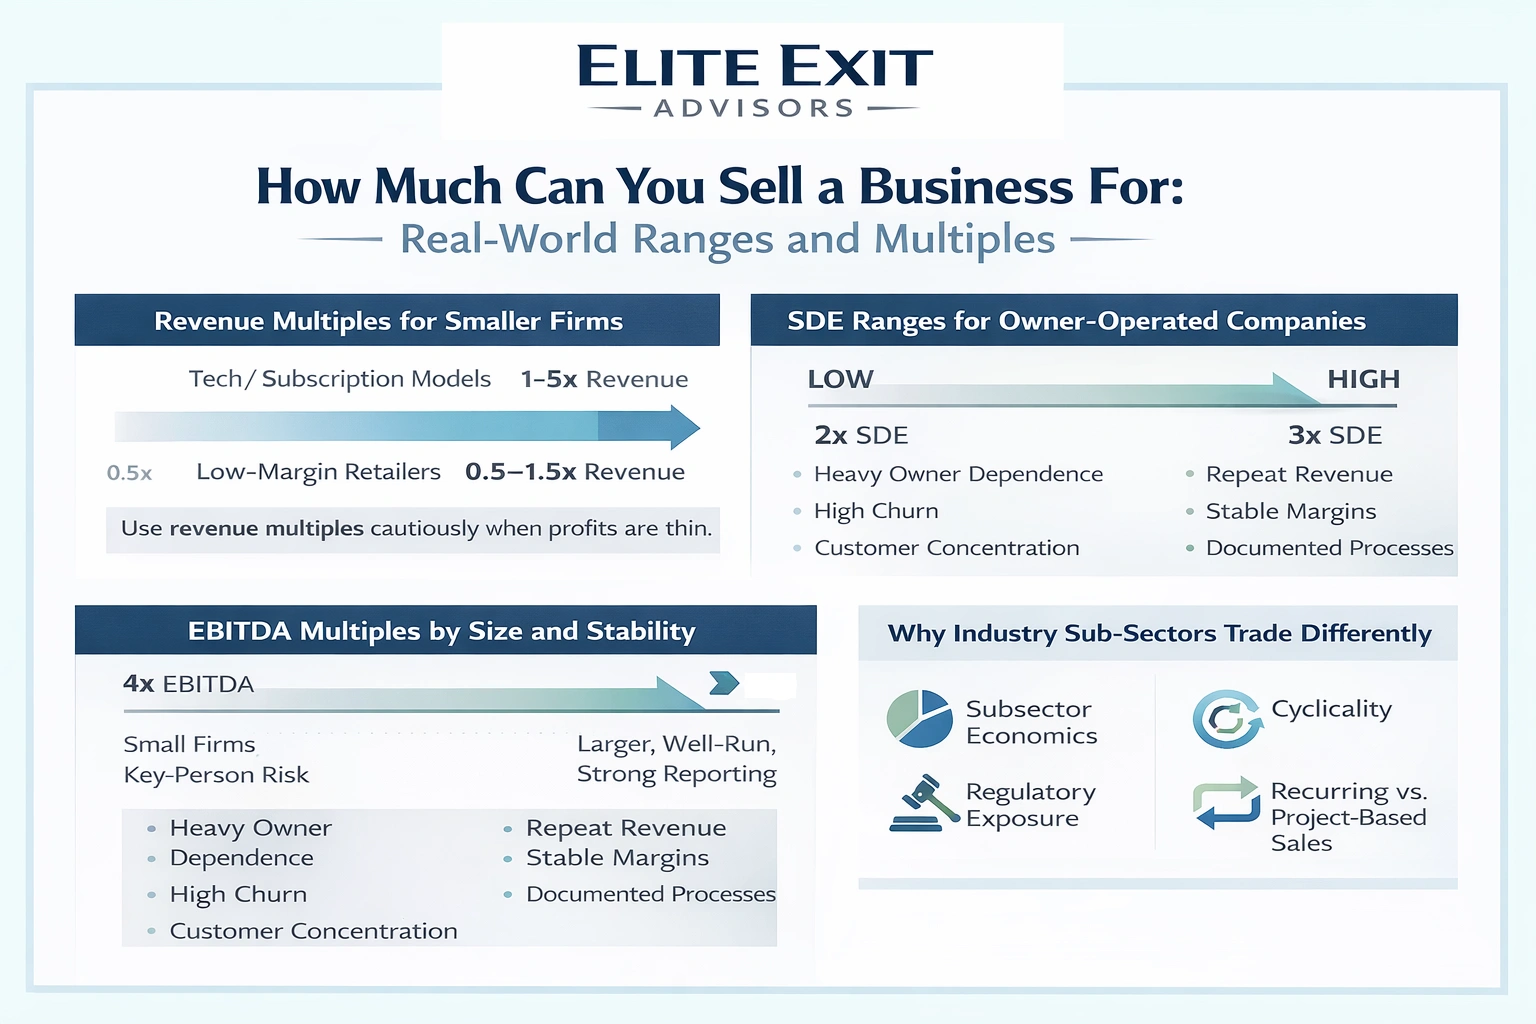
Revenue multiples offer a quick proxy for fast-growing or low-profit firms. Typical practice shows wide variation: tech or subscription models may trade at higher revenue rates, while low-margin retailers trade lower. Use revenue multiples with caution when profits are thin.
Owner-operated companies often use SDE. Typical SDE ranges sit near 2–3x for many small firms.
Lower middle-market EBITDA multiples frequently range about 4–8x. Smaller firms with key-person risk hit the low end; larger, well-run companies with strong reporting reach higher multiples.
Two firms in the same industry may fetch different values due to subsector economics, cyclicality, regulatory exposure, and recurring versus project-based sales. Real-world outcomes reflect buyer views on risk, growth, and transferability, not just past earnings.
Three core approaches guide most appraisals, each fitting different company profiles and data quality. Advisors select the framework that best matches operations, documentation, and buyer intent.
Definition: Net assets minus liabilities, using conservative marks on equipment, inventory, and receivables.
This approach is most defensible for asset-heavy firms like manufacturing, real estate, or fleets. Key inputs include detailed balance sheets, fixed-asset schedules, and lease records.
Definition: Value derived from transaction comps and multiples in the same sector.
Best where reliable comparables exist and deal terms are transparent. Required inputs include recent transaction data, industry multiples, and size/region filters.
Definition: Present value of projected cash flows, typically via DCF or capitalization methods.
This suits firms with predictable earnings. Forecasts, working-capital plans, and discount-rate rationale form the core inputs. Risk appears as higher discount rates when forecasts are uncertain.
Later sections break down market comps, SDE, EBITDA, revenue multiples, DCF, and asset/book value so readers see practical calculations and document checklists.
Market comps turn scattered sales data into a practical multiple that guides negotiations. Market-based valuation compares recent sales of similar companies to generate a usable benchmark. That benchmark helps set realistic expectations for price and lender review.
Good comps match on industry, size, margins, geography, customer mix, and growth. Weak comps, different margins or limited transactions, produce misleading multiples.
Normalize differences before applying a multiple. Adjust for earnings quality, owner pay, working-capital needs, and customer concentration. After adjustments, a median multiple from reliable sales becomes a defensible starting point.
Prepare a clear comp narrative mapping risk, growth, and operational maturity to justify the chosen multiple to buyers and lenders.
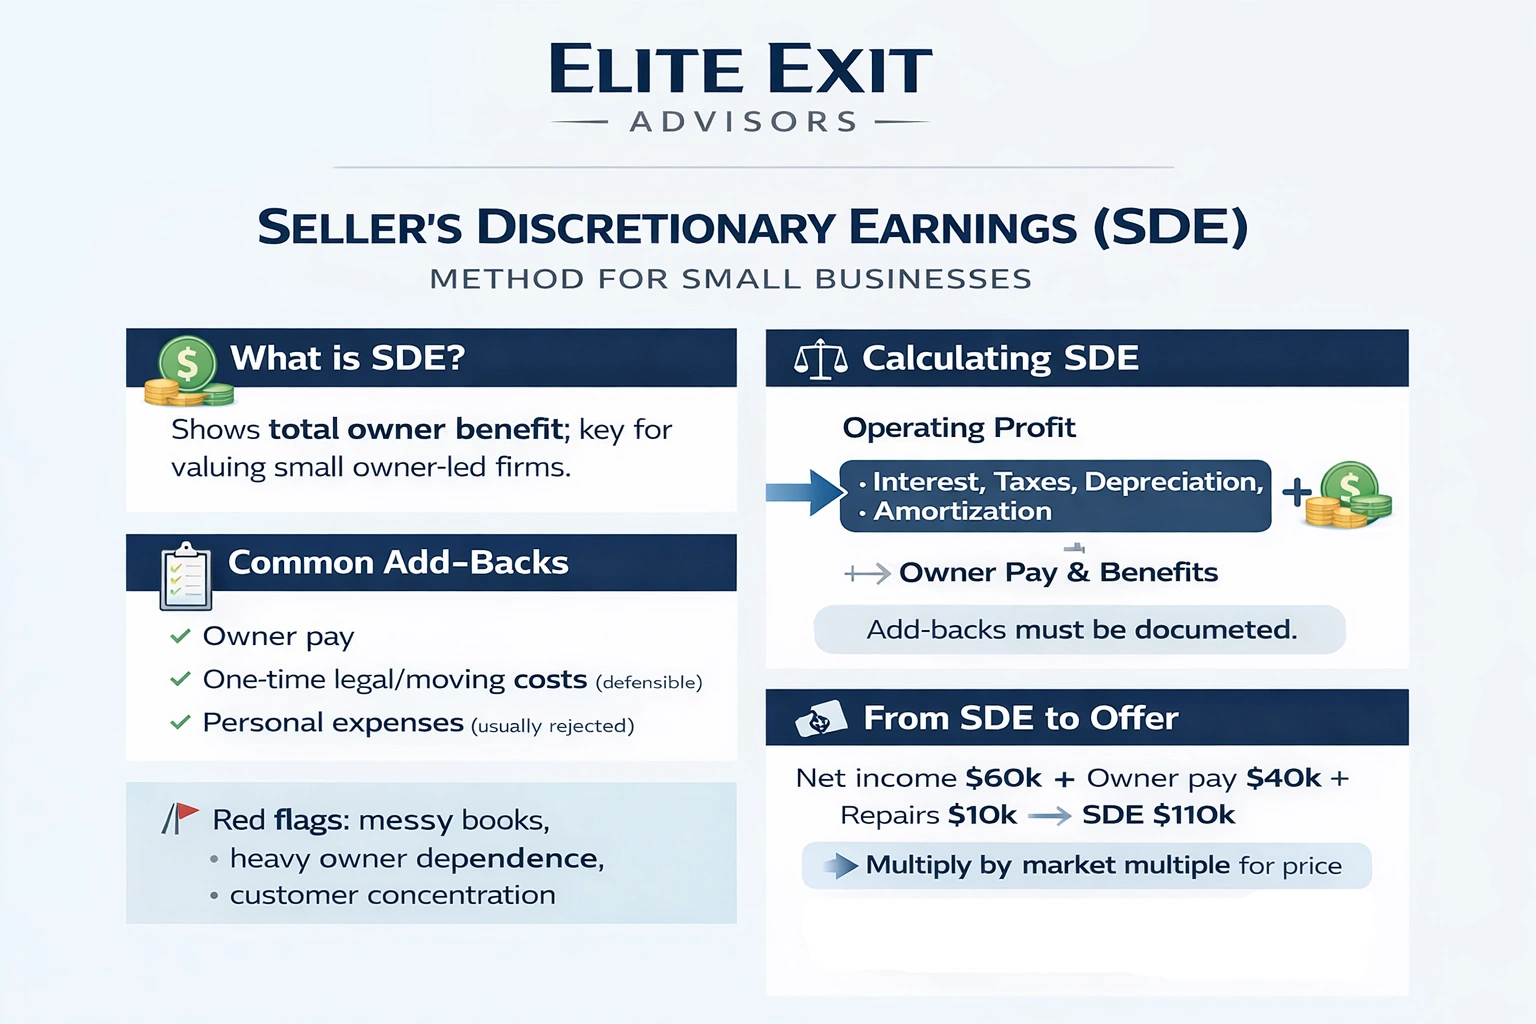
For many small, owner-led firms, SDE is the clearest snapshot of total owner benefit and the starting point for valuation.
Start with operating profit and reconcile to EBITDA by adding back interest, taxes, depreciation, and amortization. Next add owner compensation and other owner-specific benefits that would not continue under new ownership.
Buyers multiply a normalized SDE by a market multiple to set price. That multiple reflects operational risk, time to stabilize, and confidence in maintaining earnings.
Red flags that compress value include messy books, undocumented cash expenses, heavy owner dependence, and customer concentration.
Example outline: tax return net income might be $60k, add owner pay $40k and one-time repairs $10k, yielding SDE of $110k, materially different when framing sale negotiations.
For mid-market firms, buyers use EBITDA to compare core operating performance without capital structure noise. This metric cleans net income and adds interest, taxes, depreciation, and amortization, producing an adjusted view of profit that supports lender underwriting and buyer due diligence.
EBITDA = net income + interest + taxes + depreciation + amortization. Buyers expect an adjusted ebitda that removes one-time items and normalizes owner pay.
Compute adjusted ebitda, then apply a market-derived multiple to estimate enterprise value. Buyers then convert enterprise value to take-home proceeds using cash-free/debt-free and working-capital targets.
For fast-scaling firms, top-line revenue often tells a clearer near-term story than current profit. When founders reinvest heavily, earnings lag even as market traction grows. In that case, buyers may value momentum over present margins.
Revenue serves as a proxy for demand and market fit. Recurring income, low churn, and predictable renewal patterns raise confidence in future cash flow.
Use this method with strict guardrails. Check gross margin, contribution margin, and CAC/LTV. If margins are thin, a high multiple can mislead.
Growth rate, retention, and total addressable market all move the multiple. Rapid deceleration in growth often compresses valuation even when revenue remains large.
Example outline: use trailing twelve-month revenue, apply a market-derived multiple, then adjust expectations by margin and concentration risk to reach a realistic valuation range.
Discounted cash flow (DCF) turns future receipts into today's dollars. It fits firms with steady, predictable earnings and multiple years of reliable records that support forward-looking projections.
Build multi-year projections using realistic revenue trends, margin stability, and reinvestment needs. Model working-capital shifts and periodic capital expenditure so forecasts reflect true operating needs.
Keep assumptions conservative. Tie growth to past performance and market context rather than optimistic targets.
The discount rate shows required return and market risk. A higher rate equals greater perceived risk or scarce financing; a lower rate signals steady cash and easier financing.
Standard DCF formula: PV = Σ (FCFt / (1 + r)^t). For three years, discount each year’s forecast by r (for example, 4.5%). Sum the present values to get a terminal present value estimate.
Over-optimistic growth, ignoring reinvestment, and using an unrealistically low discount rate inflate value. Overly conservative forecasts or ignoring durable advantages undervalue it.
Buyers will cross-check DCF outputs against market comps and lending norms to see if the implied valuation is financeable and realistic.
When earnings wobble, tangible assets and inventory often set the floor for a sale outcome. This method uses the balance sheet to produce a conservative valuation that buyers trust when cash flow is volatile.
Value = total tangible assets − total liabilities. Gather a current balance sheet, debt schedules, and an itemized asset list to compute this cleanly.
Equipment, vehicles, real estate, and inventory are tangible and easy to price. Reputation, goodwill, and IP are intangible and rarely appear fully in book value.
Book value often misses goodwill and future earnings. Use book value as a conservative floor or downside scenario during negotiations.
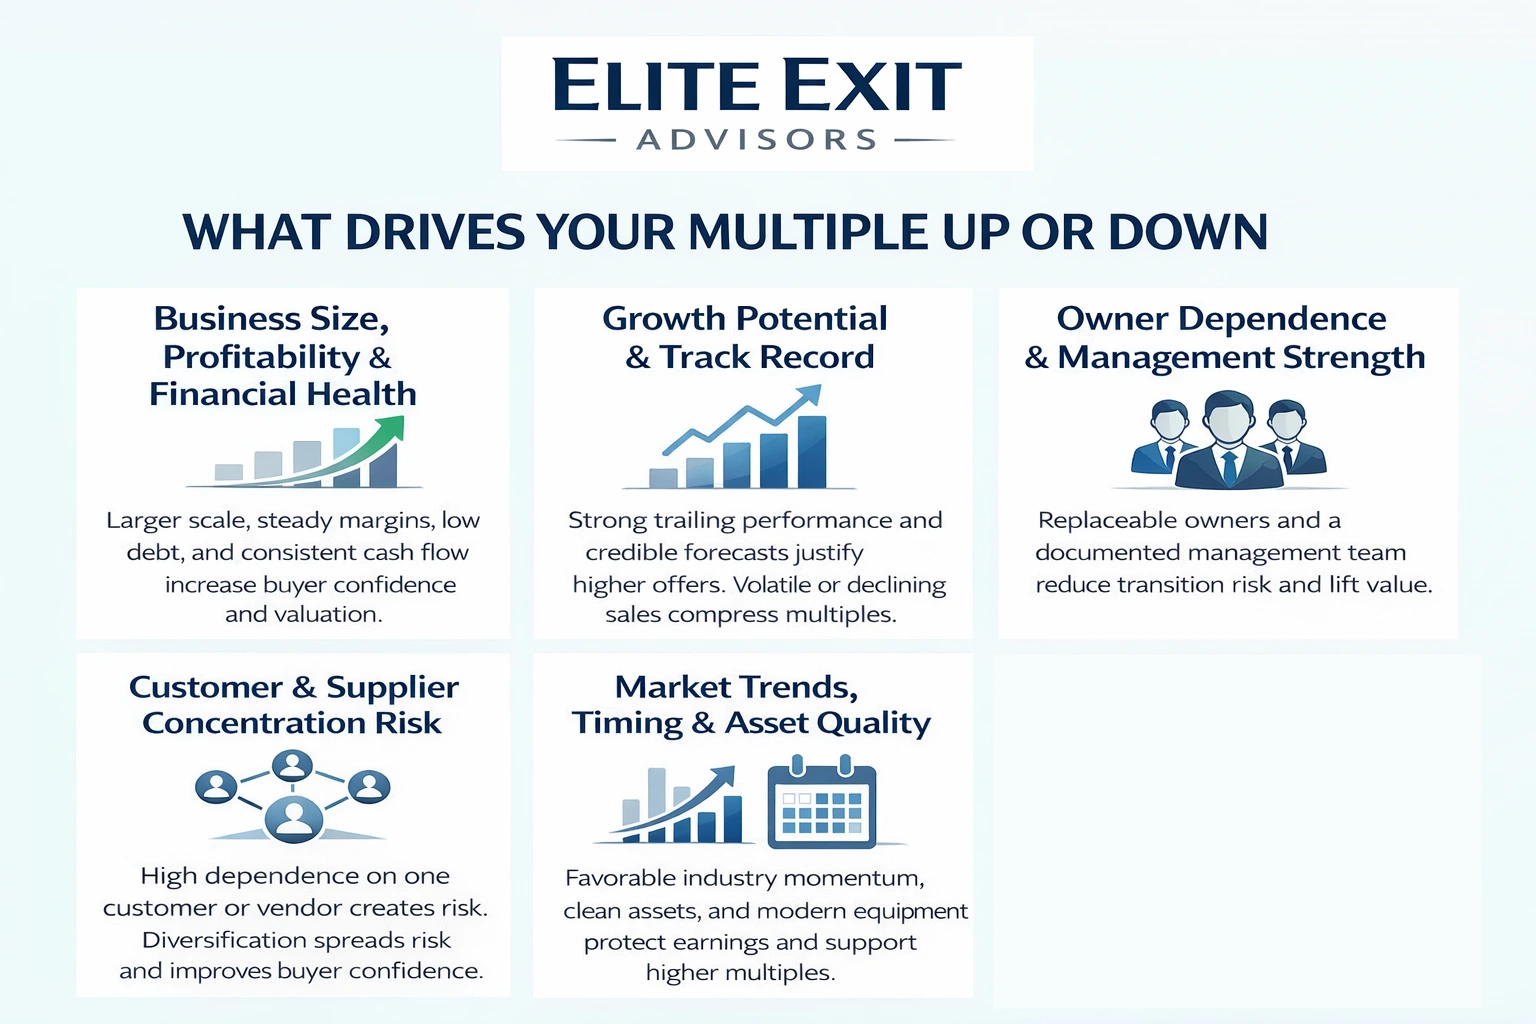
Buyers weigh a handful of factors that quickly tilt valuation toward premium or discount. Focus on clear, demonstrable improvements to raise perceived value and reduce underwriting risk.
Larger scale often lets a company command higher multiples. Firms with steady margins, low debt, and consistent cash flow reduce buyer concern and increase value.
Recent growth matters. Strong trailing performance and credible forecasts show potential and justify higher bids. Volatile or declining sales lower appetite and compress multiples.
Replaceable owners and a strong management team make operations transferable. Documented processes and depth in key roles cut transition risk and lift value.
High dependence on one customer or vendor creates underwritten risk. Diversification spreads risk and improves buyer confidence.
Industry momentum and favorable financing conditions increase buyer demand. Clean assets, modern equipment, and efficient operations protect earnings and reduce post-close capital needs.
Elite Exit Advisors focuses on turning financial signals into a clear negotiation story that buyers will underwrite. That approach ties value to defensible methods rather than hope.
We match valuation method to company size, margins, and predictability. That means choosing SDE, EBITDA, revenue multiple, DCF, or asset-based work that best fits facts on the ground.
Our services tighten reporting, validate add-backs, and reduce dependence on any single owner or client. The goal is a price that holds during diligence and closes on fair terms.
If ready to improve valuation and sale outcomes, book a call with Elite Exit Advisors for a valuation-readiness roadmap and a practical plan to lift multiples and close stronger.
True market value reflects the method that best captures a company's cash flow and growth pattern. No single figure fits all firms; fair valuation depends on profile, documentation, and buyer underwriting.
Practical takeaways: use market comps for reality checks, SDE for owner-led firms, EBITDA for mid-sized companies, revenue multiples for high-growth profiles, DCF for steady cash flows, and asset-based work for asset-heavy operations.
Buyers pay for proven, transferable earnings and lower risk. Clean financials, defensible add-backs, and reduced customer or owner concentration materially affect offers. Those factors move multiples and final value.
Owners who quantify value, reduce risk, and present a clear, buyer-ready story raise the odds of sustaining a target price through diligence and closing a successful sale.
