

EBITDA (Earnings Before Interest, Taxes, Depreciation, and Amortization) shows a business’s operating cash flow before non-cash expenses and financing or tax effects, making it useful for comparing profitability across companies and industries. A good EBITDA looks like it is industry-specific, but benchmarks offer useful context. For example, as of 2025, the average EBITDA margin for service providers in the U.S. is around 9.8%.
Operating Income, also known as Operating Profit or EBIT, reflects profit from core business operations after operating expenses, including depreciation and amortization, but before interest and taxes.
Two commonly reported profit measures help separate recurring performance from one-time events. They show whether rising revenue reflects durable margin gains or temporary factors. This clarity matters for valuation, budgeting, and lender conversations in the United States.
One metric highlights the company's core and keeps items tied to day-to-day execution visible. That makes it easier to judge pricing, labor, overhead, and cost control.
The other metric removes financing and tax differences to create a standard view of earnings capacity across companies. This helps when comparing firms with different debt levels or tax situations.
Investors watch the first measure to gauge management effectiveness and recurring profit trends. Lenders and buyers rely on the second when assessing debt service capacity and valuation multiples.

This metric records profit a company earns from its regular business after subtracting the costs needed to run those activities. It is a GAAP figure reported on the income statement and helps show whether the core model is profitable without financing or tax effects.
Where it sits: Conceptually, it appears after gross profit and the deduction of operating expenses, but before non-operating results, interest, and taxes.
Analysts favor this number to assess management effectiveness. Sustained growth here often signals pricing power, tighter cost control, or improved operating leverage, signs of a healthier core business.
A common non‑GAAP profit measure strips out financing, taxes, and noncash charges to focus on recurring earnings power. This metric helps compare firms with different capital structures and tax profiles but can differ by company reporting choices.
The figure is not a GAAP line, so companies may present an adjusted version. Firms often remove one‑time expenses such as restructuring or unusual legal costs. Verify disclosures to see what management adds back.
It can obscure heavy debt service, real cash taxes, working capital needs, and ongoing capital spending. Depreciation is noncash today but signals past capital outlays and future replacement needs. If the metric looks strong while cash is tight, dig into capex and interest obligations.
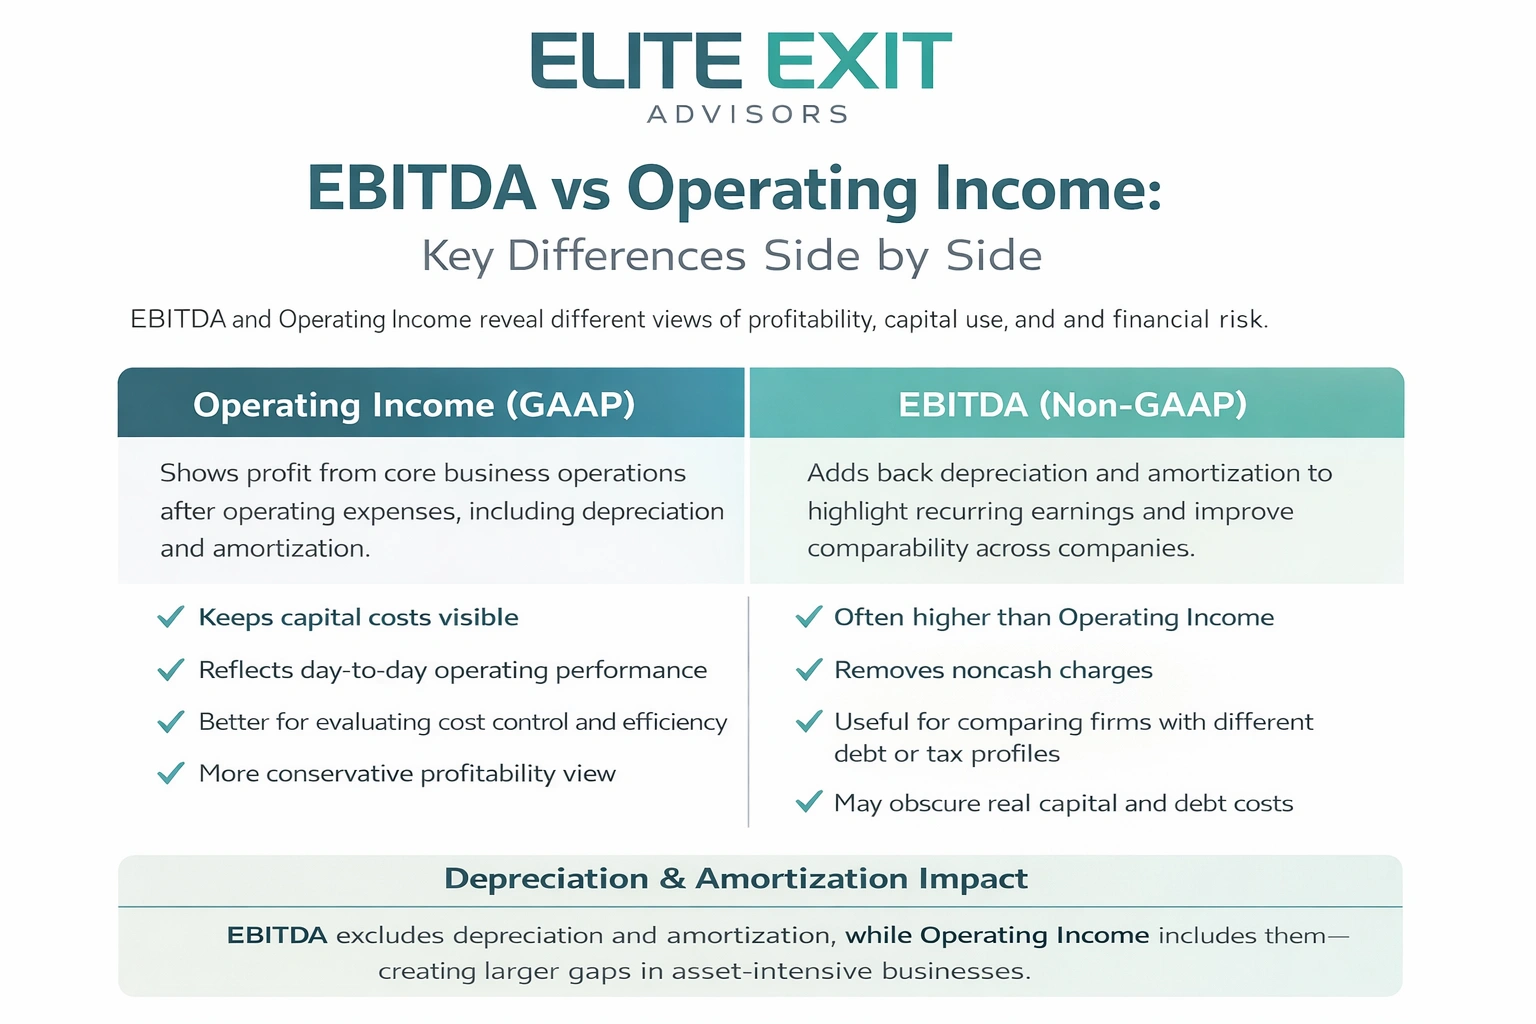
Quick comparison: these measures tell different stories about profit and capital use. One adds back noncash charges to highlight recurring cash capacity. The other stays within GAAP, keeping depreciation visible so capital consumption shows up in results.
When a company adds back depreciation and amortization, the resulting metric will typically be larger than the GAAP line that includes those costs.
This gap widens in asset‑intensive businesses where D&A is significant.
Operating income focuses on day‑to‑day profit after customary operating expenses.
EBITDA takes a broader earnings view, strips D&A, and often helps compare across capital structures.
Excluding interest and taxes improves comparability between companies with different debt or tax situations.
But that exclusion reduces visibility into real cash obligations.
Practical takeaway: use the GAAP measure to judge daily execution and the adjusted metric to frame capacity and comparability, then reconcile both to cash realities. Validate both when covenants or valuation multiples depend on them.
Follow a clear, step-by-step method to recreate profit lines from today’s financial statements. Start at top and move down to see how revenue flows into reported profit figures.
1. Revenue → subtract cost of goods sold → gross profit.
2. Subtract operating expenses (including payroll, rent) and depreciation and amortization to reach operating income.
Derive operating income from net income by adding back interest and taxes and removing non‑operating gains or losses. Verify classifications before you adjust.
Watch for common confusion: depreciation may sit in COGS or SG&A; amortization often appears under intangible costs; other income/expense lines can distort roll-ups.
Quick bridge: start at operating income, add depreciation and amortization to reach EBITDA; this removes noncash wear but not interest or taxes. Keep definitions stable year‑over‑year for valid trend analysis.
Choose the right metric and start with how asset-heavy a business is and what costs drive its margins.
When equipment, facilities, or acquired intangibles matter, the impact of depreciation and amortization changes reported profit. In those firms, the GAAP measure that includes those charges better reflects true replacement and capital costs.
By contrast, asset-light companies with small depreciation and amortization often highlight ebitda to compare performance across different tax and financing structures. That metric can clarify operating efficiency without capital noise.
Operating profit margin = (operating income ÷ revenue). Use it to judge cost control, pricing, and core operations.
EBITDA margin = (ebitda ÷ revenue). Use it for standardized benchmarking, but reconcile to capex and working capital before drawing conclusions.
Decision tip: use the GAAP measure as an operational scorecard and ebitda as a comparability snapshot. Always benchmark peers with consistent definitions before acting.
Deal teams frequently reference a normalized earnings figure to align comparisons across different capital structures. That metric often anchors purchase multiples and tests a company's debt coverage before buyers set price ranges.
EBITDA is popular because it standardizes earnings by removing tax, interest, and noncash charges. Buyers use it to compare peer companies and to size leverage in leveraged buyouts.
Even so, bidders will pressure‑test that number against working capital, capex, and debt service to confirm real cash capacity.
The GAAP line that includes depreciation and amortization can be more persuasive when asset maintenance and reinvestment shape future costs.
Performance reviews use it to track gross margin gains, tighter expense control, and operational improvements over time.

Elite Exit Advisors helps owners turn financial lines into clear, transaction-ready narratives for buyers and lenders. We align internal reports with what a buyer or lender expects to see, so the company presents consistent, verifiable metrics during reviews.
We reconcile operating income to ebitda with documented adjustments. That process separates one-time items from true recurring earnings.
Our team prepares tidy reporting packages that link the income statement to operational drivers. Buyers gain confidence when depreciation, amortization, and capex needs are anticipated and explained.
We support preparation, positioning, and negotiation so owners can discuss multiples, margins, and normalized earnings with clarity.
Clarify your recurring earnings: reconcile operating income to ebitda with clean adjustments, identify levers to improve core profitability, create buyer‑friendly reporting, and support deal strategy from preparation through exit. Book a call with Elite Exit Advisors to discuss how to present these metrics clearly for valuation, financing, or an upcoming sale.
To finish, think of one metric as the operational scorecard and the other as a comparability tool. Operating income measures profit from core activity after normal costs and shows how well management runs the business. ebitda adds back depreciation and gives a cleaner basis for peer comparison and valuation.
Keep a clear caution: the adjusted metric can look strong even when debt, capital reinvestment, and real cash outflows create pressure. Watch for discretionary add‑backs and confirm any reconciliation to cash flows.
Bridge the two with consistent formulas, validate adjustments, and review interest and taxes, depreciation, and expenses before drawing conclusions. Use both figures alongside cash-focused context to make better decisions today.
