

EBITDA margin is a core profitability metric that shows how much of a company’s revenue is converted into operating earnings before interest, taxes, depreciation, and amortization. In practical terms, it expresses EBITDA as a percentage of net sales, giving you a clear view of a company’s operational efficiency and cost control without distortions from financing decisions or non-cash accounting charges. This makes it especially useful for comparing performance across companies of different sizes and capital structures.
A good EBITDA looks like it is industry-specific, but benchmarks offer useful context. For example, as of 2025, the average EBITDA margin for service providers in the U.S. is around 9.8%.
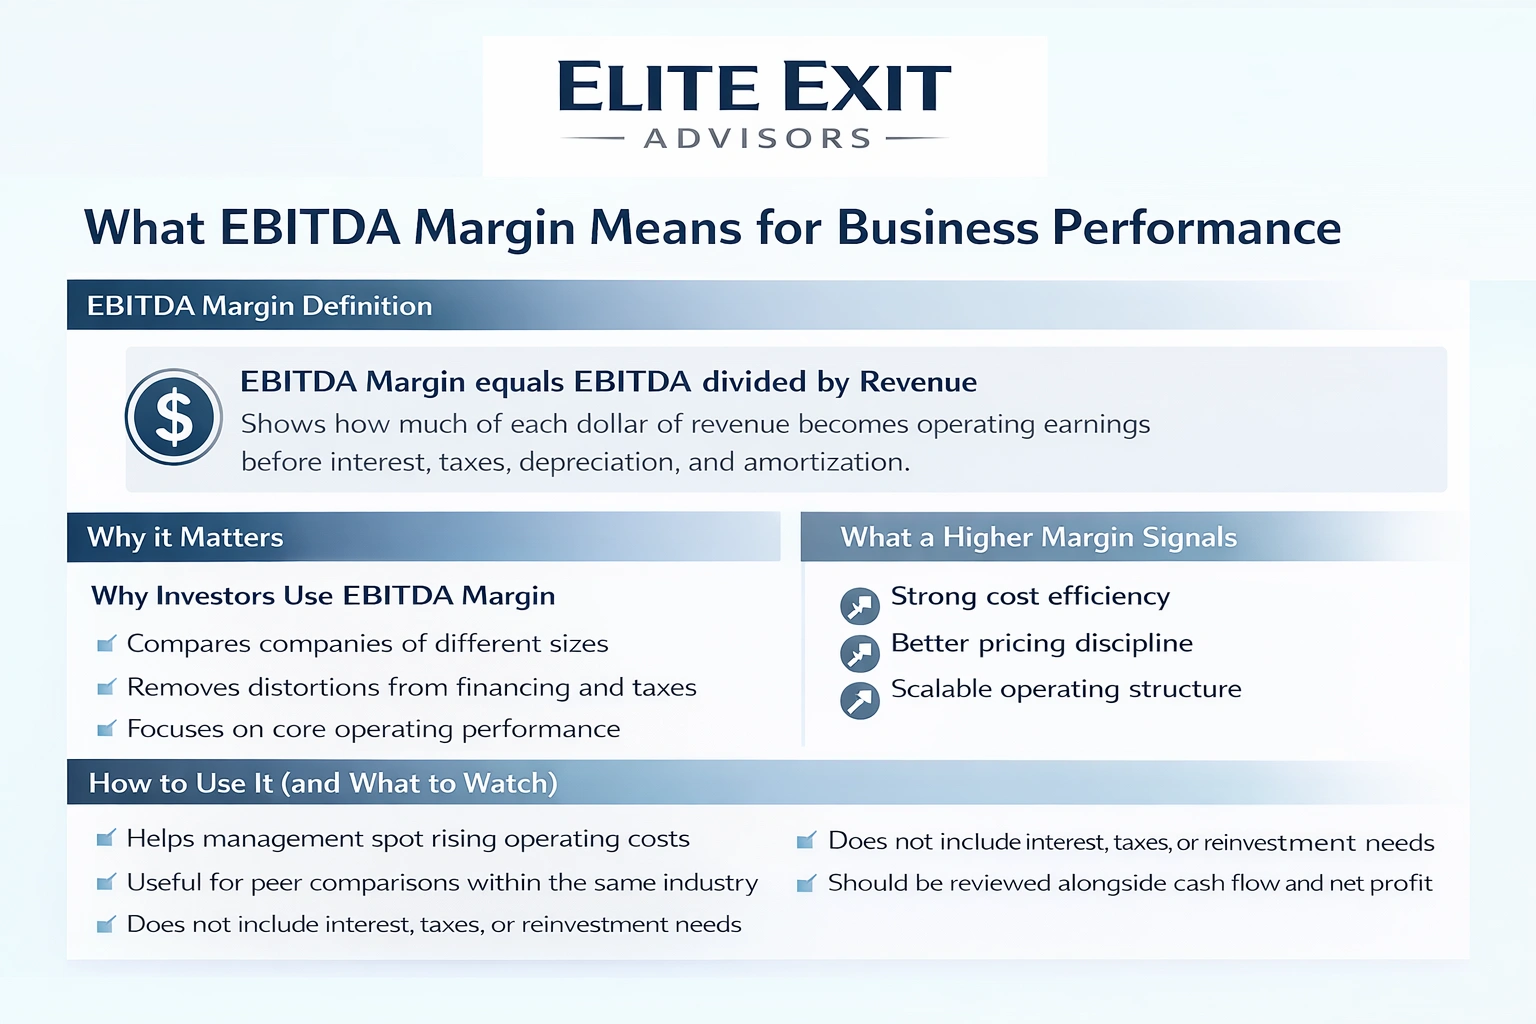
The EBITDA margin is a straightforward ratio that expresses EBITDA as a percent of sales. It shows what portion of revenue "trickles down" to core operating profitability.
Investors and analysts favor this measure because it lets them compare companies of different sizes within the same industry without size alone distorting the picture. It highlights operating performance rather than financing or tax choices.
A higher EBITDA margin typically signals stronger cost efficiency, pricing discipline, and a scalable operating structure. When peers show similar revenues, a better margin often points to tighter expense control or superior unit economics.
Understanding which costs are excluded helps you read operating performance more clearly. Below we unpack the letters and show how this measure differs from net results and cash metrics.
The acronym spells out the exclusions: interest, taxes, depreciation, and amortization. Removing these items focuses the figure on core operating earnings.
Depreciation and amortization are accounting charges tied to assets and past acquisitions. They can swing with asset intensity, so excluding them keeps the operating view cleaner.
Net profit includes financing costs and tax. That means net profit shows the true bottom-line impact of debt and tax planning.
Use the operating measure for comparability, but remember it omits real costs that affect owner returns.
The figure can approximate operating cash generation because it adds back non-cash charges. Yet working capital swings and capital expenditures still affect real cash.
What it leaves out:
Start with a simple, repeatable calculation to make comparisons fair. The core formula is clear: EBITDA ÷ net revenue. Express the result as a percentage for reporting and benchmarking.
Net revenue = gross revenue minus returns, discounts, and sales allowances. Use that net line as the denominator every time you compare companies.
Collect revenue, COGS, operating expenses, and operating profit lines from the income statement. Pull depreciation and amortization from the cash flow or notes and add them back since they are non-cash accounting charges.
Consistency matters: always use the same revenue definition and the same add-back policy when comparing peers. Remember this is a non-GAAP measure, so document choices and disclosures to keep comparisons clean.
Practical, small-number examples make the ratio easy to use on real statements. Below are two short scenarios that show the arithmetic and what to inspect when results look similar.
Start with EBITDA of $15,000 and revenue of $125,000.
Do the math: 15,000 ÷ 125,000 = 0.12, or 12%. That means for each dollar of revenue, about 12 cents becomes operating earnings before financing and taxes.
Imagine revenue $125,000, COGS $60,000, and operating expenses $40,000. Subtract those to get operating profit before depreciation.
Add back depreciation and amortization of $10,000 to reach the same $15,000 EBITDA figure. This shows how COGS and operating expenses combine with depreciation to produce the reported number.
Two companies can both report a 12% figure yet have different depreciation and amortization schedules.
One firm may be asset-light; the other may carry heavy equipment with large depreciation. That shifts operating profit and net income even though the EBITDA result looks identical.
Note: Examples are illustrative. For diligence, use consistent definitions and confirm period alignment. If you want help translating these figures into an exit-ready story, Elite Exit Advisors can assist.
Across U.S. firms, a "good" operating result is relative to peers and historical trends, not an absolute number. Sector economics, cost structure, and pricing power shape what counts as healthy performance.
No universal cutoff exists because each industry has unique unit costs and capital needs. Compare your company to direct competitors and adjacent peers with similar sales cycles and cost drivers.
Many analysts use a simple rule: figures above 10% are frequently seen as favorable in the U.S. context. Still, high percentages in one sector can be mediocre in another.
Benchmark two ways:
Use multiple metrics, gross margin, operating margin, and net profit, to see what drives changes in the operating percentage.
Watch for distortions: one-time costs, pricing shifts, or changes in sales mix can temporarily inflate or depress results. Normalize for these factors to get a true view of ongoing business performance.

Three common profitability ratios sit at different points on the income statement and tell distinct parts of the same story. Each helps you see performance from another angle.
EBIT (used for operating margin) equals operating profit after depreciation and amortization. Operating margin = ebit ÷ revenue, so this ratio captures asset-related charges that EBITDA excludes.
The EBITDA-based percentage typically reads higher than net profit because net profit subtracts interest, taxes, and other non-operating items. Those deductions reduce the final profit share available to owners.
Where a metric sits affects comparability. The closer to operations, the less influence from financing and tax decisions. The lower the line, the more company-specific accounting and capital structure shape the picture.
Select the right profitability measure and match the question you need to answer to the costs it includes. Different earnings metrics exclude different items, so each serves a distinct decision role.
EBIT removes interest and taxes from the bottom line. It is often called operating income.
Use ebit when depreciation and amortization reflect real recurring costs tied to assets. This helps assess asset-heavy operations and capital use.
EBITA strips out amortization in addition to interest and taxes. This can clarify performance for acquisitive companies with large acquisition-related amortization charges.
Pick ebit_a when amortization swings between peers and hides underlying operating strength.
EBITDA is the common operational proxy used in finance, lending, and valuations because it removes both depreciation and amortization and focuses on cash-like earnings.
Always apply the same calculation across peers to avoid distorted comparisons.
This operating measure is popular because it lets analysts compare core results without the distortions of borrowing and tax rules.
Capital structure neutrality means two firms that run identical operations but fund them differently can show similar operating outcomes. Removing interest expense reduces the distortion caused by different debt levels and financing mixes.
Tax rates and rules vary by state and country. Excluding taxes makes cross-border and cross-state comparisons cleaner and helps buyers and lenders assess companies on similar footing.
This metric focuses attention on pricing, control of COGS, and how well operating expenses are managed. That makes it useful in valuation and lending because it approximates operating earnings available before financing and taxes.
Caution: being widely used does not make it sufficient. Always review cash flow, debt, working capital, and capex to complete the financial picture.
Small shifts in pricing or product mix can change a company's operating percentage faster than headline revenue growth. Use this checklist to diagnose which levers drive change and where to act first.
Revenue is more than top-line growth. Pricing power, discount leakage, returns, and a shift toward low-margin sales all reduce effective revenue and squeeze the company's EBITDA margin.
COGS sets the gross margin ceiling. Supplier terms, yield, and input price swings directly affect how much sales convert to operating profit.
Operating expenses determine the cost to run the business. Headcount, systems, and fixed overhead scale differently and can erode or lift the company's EBITDA figure.
Depreciation and amortization signal capital intensity. Capitalization and classification choices can change reported operating and net results, even when the operating percentage looks similar.
Higher sales can improve absorption and purchasing leverage. But complexity, acquisition costs, and service burdens can offset scale gains.
Diagnostic checklist: test pricing, inspect COGS drivers, audit SG&A trends, review D&A policy, and model scale breakpoints.

Meaningful profit gains come from targeted cost moves and smarter pricing, not across-the-board cuts. Use a focused playbook that protects revenue quality while lifting operating results and cash flow.
Run a zero-based review to re-justify every budget line each period. Ask teams to show measurable returns for recurring spend.
Stop legacy subscriptions, consolidate overlapping tools, and shift fixed costs to variable where possible to lower risk as sales change.
Build price architecture and approval workflows that limit unmanaged discounts. Segment customers by profitability and apply targeted offers only where payback is clear.
Train sales to sell value, not just price, and monitor approval logs to stop leakage that erodes profitability.
Negotiate longer-term supplier terms, buy in predictable bundles, and redesign workflows to cut waste. Small yield improvements multiply at scale.
Shift spend to channels with the best CAC-to-gross-profit payback. Measure campaigns by contribution margin, not just leads or bookings.
Build dashboards that link the operating percentage to operating profit, working capital, and cash flow. Review weekly to catch trends early.
A disciplined adjusted figure helps separate recurring performance from one-time noise. Adjusted EBITDA recalculates operating earnings and removes items that do not reflect ongoing business activity. Buyers, lenders, and advisors request this to assess sustainable earnings power and real profitability.
Adjustments exclude non-recurring items and one-time costs that distort the operating picture. The goal is a repeatable, comparable figure that reflects normal operations.
Because this metric is non-GAAP, inconsistent add-backs can inflate the figure and hurt credibility in diligence. Provide general ledger support, invoices, payroll records, lease comparables, and a written rationale that links each adjustment to recurrence or lack thereof.
Link to valuation: multiples get applied to the adjusted figure, so disputes about what is “ongoing” often drive price negotiation. A clean, well-documented adjusted number reduces diligence friction and helps management defend the company’s earnings story.
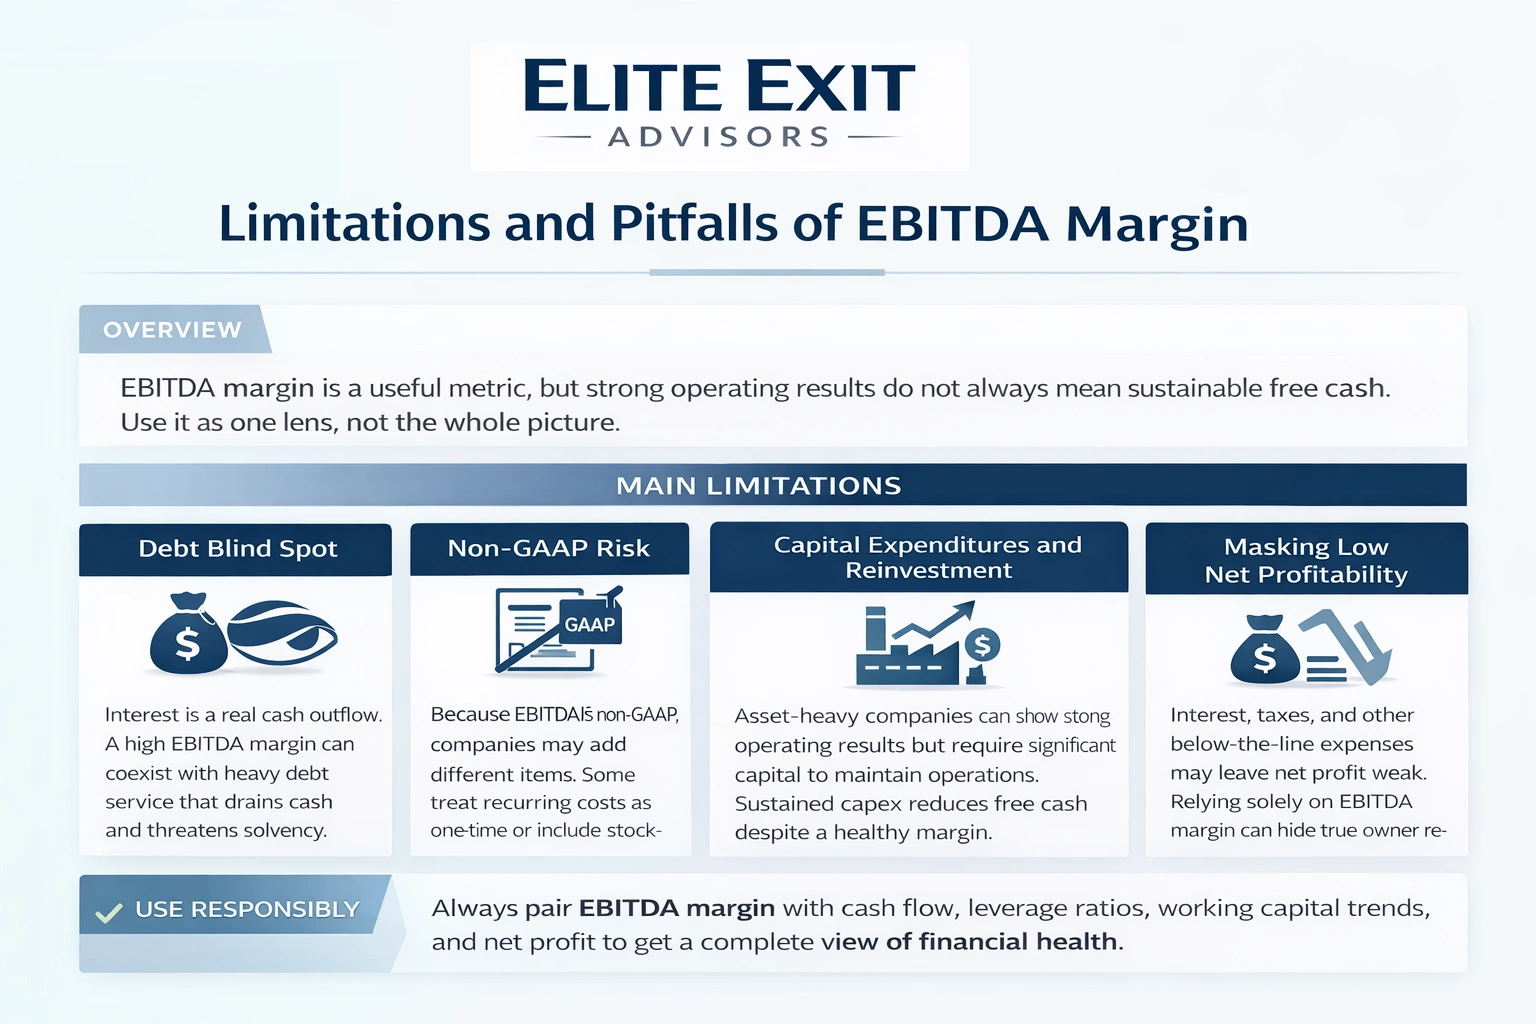
Strong reported operating results do not always mean the business generates sustainable free cash. Treat the EBITDA margin as one lens, not the whole view.
Interest is a real cash outflow. A high operating percentage can coexist with large debt service that drains cash and threatens solvency.
Because this is a non-gaap measure, companies may add back different items. Some add stock-based pay or label recurring costs as "one-time," which reduces comparability and raises risk for buyers.
An asset-heavy company can show attractive operating results yet need heavy capital to run. Sustained capex lowers free cash, even when the operating percentage looks healthy.
Below-the-line items, interest, taxes, and other expenses, can leave net profit weak. Relying only on an operating percentage can hide true owner returns.
Responsible use checklist: pair the metric with cash flow, leverage ratios, working capital trends, and net margin before making decisions.
Preparing for a sale means turning operating gains into a defensible valuation narrative. Elite Exit Advisors works with owners to translate reported EBITDA and EBITDA margin trends into a buyer-ready story backed by cash flow and documentation.
What we do first:
We recast financials to strip one-time items and create a credible adjusted figure. This creates consistent calculations and a baseline that stands up in diligence.
We prioritize pricing moves, cost-structure changes, and operational fixes that raise profitability in measurable steps.
We tie EBITDA to working capital and reinvestment needs so buyers see sustainable cash generation, not just accounting improvements.
We build defensible metrics, add-back schedules, and documentation to reduce surprises and late-stage renegotiation risk.
We position the company for a stronger valuation narrative and align performance metrics with buyer and lender expectations.
How Elite Exit Advisors supports owners:
Book a call with Elite Exit Advisors to discuss your company’s EBITDA margin, adjusted figures, and exit readiness next steps.
Treat the operating percentage as a practical diagnostic, not a single truth. The core definition is simple: EBITDA margin = EBITDA ÷ revenue. Use it to compare company operating performance across peers and over time.
Remember this is a non-GAAP metric. It highlights operating efficiency and pricing power but leaves out interest, taxes, and reinvestment needs. That means profitability and cash demands still require separate review.
Be consistent: use the same revenue definition and add-back rules so comparisons stay useful. Then calculate your current EBITDA margin, identify the top drivers (pricing, COGS, OpEx), and map focused improvements that lift results without harming growth.
Next step: apply the guide, run the math, and evaluate practical moves. For help, Elite Exit Advisors can support a defensible, diligence-ready approach.
